


Financial Highlights
SHARE


MHI has adopted International Financial Reporting Standards (IFRS16) from FY2019.
Summary of Consolidated Business Results and Forecasts
| FY2022 (Actual) IFRS |
FY2023 (Actual) IFRS |
FY2024 (Actual) IFRS |
FY2025 (Forecast) IFRS |
|
|---|---|---|---|---|
| Order intake | 4,501.3 billion yen |
6,684.0 billion yen |
7,071.2 billion yen |
5,900.0 billion yen |
| Revenue | 4,202.7 billion yen |
4,657.1 billion yen |
5,027.1 billion yen |
5,400.0 billion yen |
| Profit from business activities | 193.3 billion yen |
282.5 billion yen |
383.1 billion yen |
420.0 billion yen |
| Profit attributable to owners of parent | 130.4 billion yen |
222.0 billion yen |
245.4 billion yen |
260.0 billion yen |
Order intake and Revenue

| FY2022 IFRS |
FY2023 IFRS |
FY2024 IFRS |
|
|---|---|---|---|
| Order intake | 4,501.3 billion yen | 6,684.0 billion yen | 7,071.2 billion yen |
| Revenue | 4,202.7 billion yen | 4,657.1 billion yen | 5,027.1 billion yen |
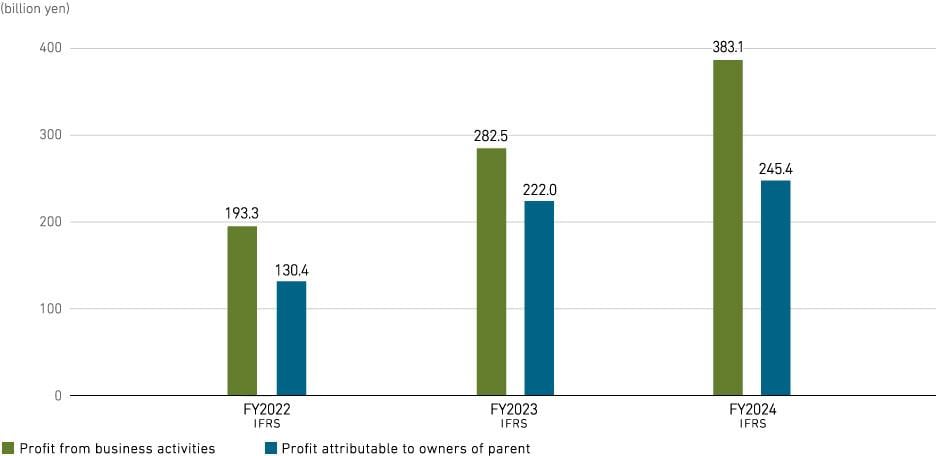
Profit from business activities and Profit attributable to owners of parent
| FY2022 IFRS |
FY2023 IFRS |
FY2024 IFRS |
|
|---|---|---|---|
| Profit from business activities | 193.3 billion yen | 282.5 billion yen | 383.1 billion yen |
| Profit attributable to owners of parent | 130.4 billion yen | 222.0 billion yen | 245.4 billion yen |
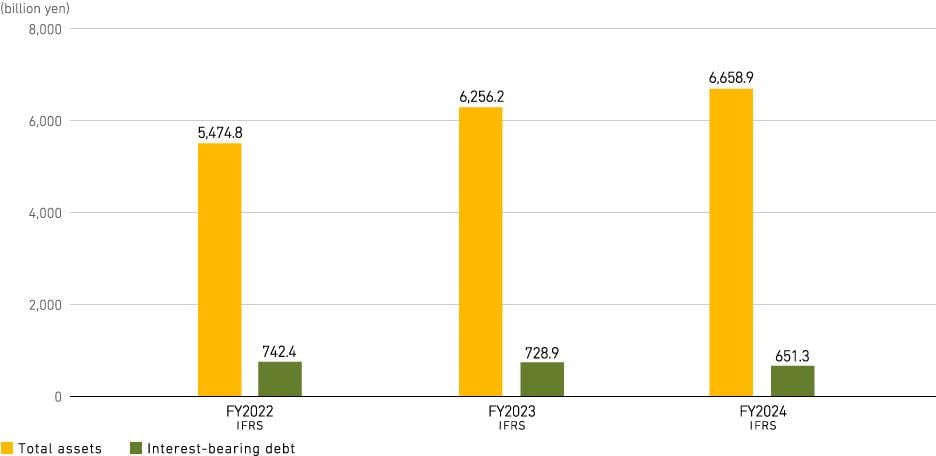
Total assets and Interest-bearing debt
| FY2022 IFRS |
FY2023 IFRS |
FY2024 IFRS |
|
|---|---|---|---|
| Total assets | 5,474.8 billion yen | 6,256.2 billion yen | 6,658.9 billion yen |
| Interest-bearing debt | 742.4 billion yen | 728.9 billion yen | 651.3 billion yen |
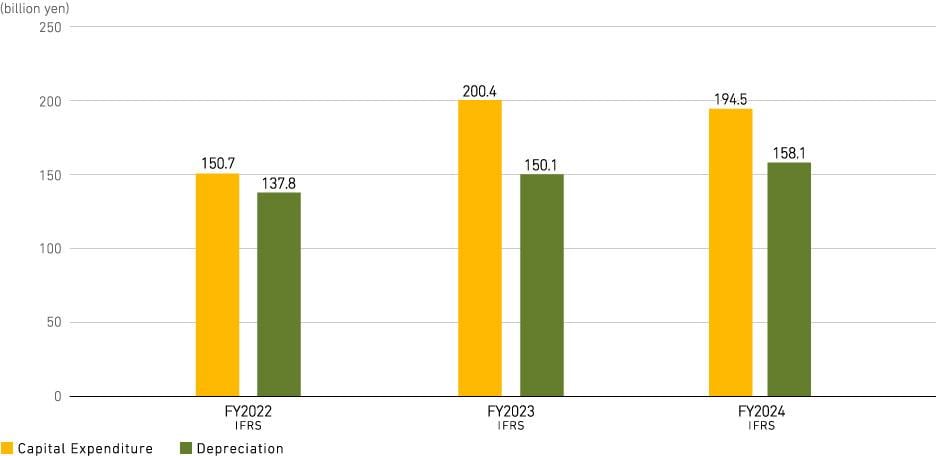
Capital Expenditures and Depreciation & amortization
| FY2022 IFRS |
FY2023 IFRS |
FY2024 IFRS |
|
|---|---|---|---|
| Capital Expenditures | 150.7 billion yen | 200.4 billion yen | 194.5 billion yen |
| Depreciation & amortization | 137.8 billion yen | 150.1 billion yen | 158.1 billion yen |
Equity and Equity ratio

| FY2022 IFRS |
FY2023 IFRS |
FY2024 IFRS |
|
|---|---|---|---|
| Equity | 1,833.9 billion yen | 2,360.6 billion yen | 2,469.8 billion yen |
| Equity ratio | 31.8% | 35.9% | 35.2% |
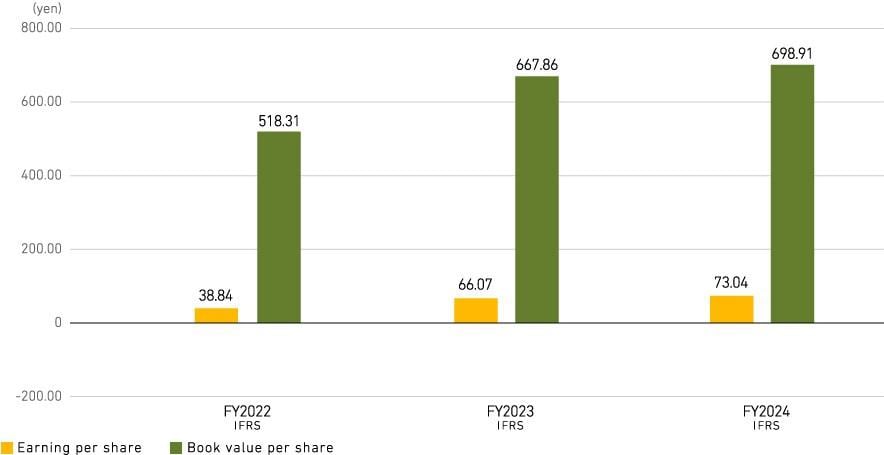
Earning per share and Book value per share
| FY2022 IFRS |
FY2023 IFRS |
FY2024 IFRS |
|
|---|---|---|---|
| Earning per share | 38.84 yen | 66.07 yen | 73.04 yen |
| Book value per share |
518.31 yen | 667.86 yen | 698.91 yen |
- On April 1, 2024, the Company executed a ten-for-one stock split of its common shares. "Earning per share" and "Book value per share" are calculated assumping that the stock split was conducted at the beginning of FY2023.
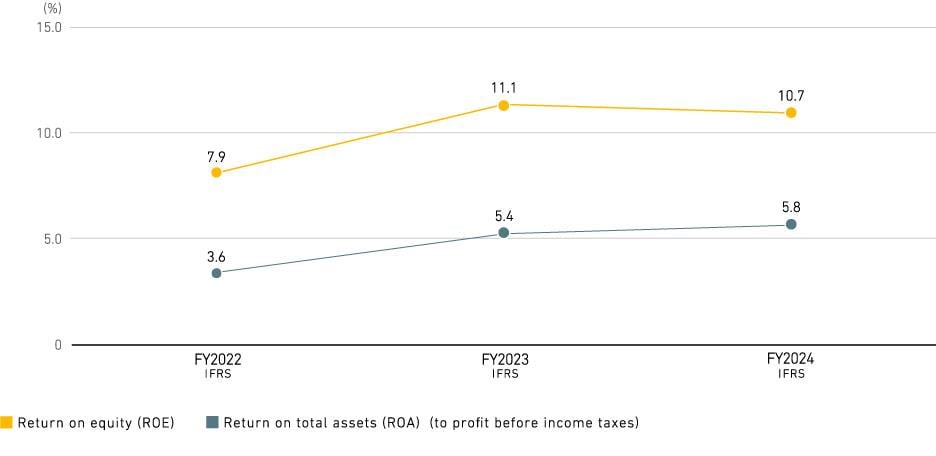
ROE and ROA
| FY2022 IFRS |
FY2023 IFRS |
FY2024 IFRS |
|
|---|---|---|---|
| Return on equity (ROE) | 7.9% | 11.1% | 10.7% |
| Return on total assets (ROA)
(to profit before income taxes) |
3.6% | 5.4% | 5.8% |
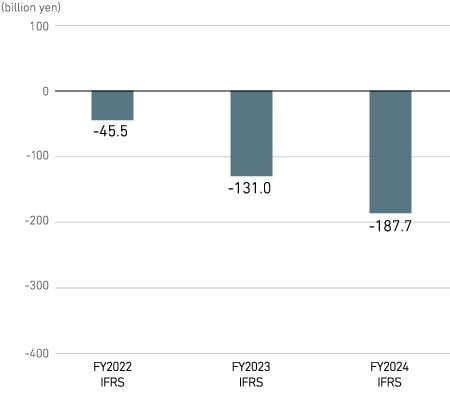
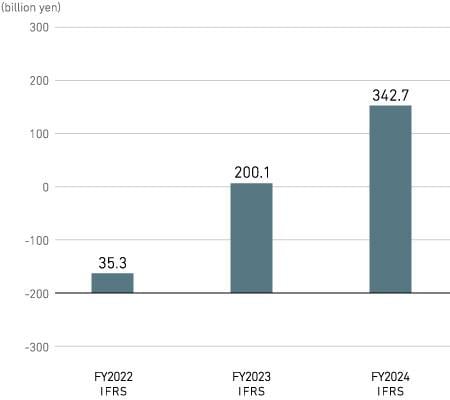
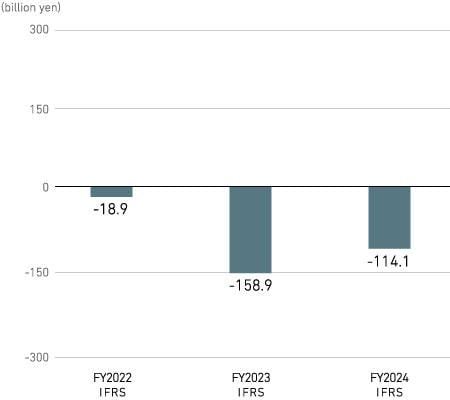
Cash Flows
Operating Cash Flow

Investment Cash Flow
Free Cash Flow
Financing Cash Flow
| FY2022 IFRS |
FY2023 IFRS |
FY2024 IFRS |
|
|---|---|---|---|
| Operating Cash Flow |
80.8 billion yen | 331.1 billion yen | 530.4 billion yen |
| Investment Cash Flow |
-45.5 billion yen | -131.0 billion yen | -187.7 billion yen |
| Free Cash Flow |
35.3 billion yen | 200.1 billion yen | 342.7 billion yen |
| Financing Cash Flow |
-18.9 billion yen | -158.9 billion yen | -114.1 billion yen |
As of the fiscal year 2018 ended March 31, 2019, Mitsubishi Heavy Industries, Ltd. has adopted the International Financial Reporting Standards (IFRS) for consolidated financial statements, in place of the Japanese Generally Accepted Accounting Principles (JGAAP) previously used.
- Return on equity (ROE) = profit (loss) attributable to owners of parent / equity attributable to owners of parent average of the beginning and the end of period
Return on total assets (ROA) (to profit before income taxes)
=profit before income taxes / total assets average of the beginning and the end of period
Earning per share (EPS) = profit (loss) attributable to owners of parent / total number of shares issued
Book value per share (BPS) = Net assets / total number of shares issued