


Main Financial Index
SHARE


Main financial index
| Unit | FY2018 (IFRS) |
FY2019 (IFRS) |
FY2020 (IFRS) |
FY2021 (IFRS) |
FY2022 (IFRS) |
|
|---|---|---|---|---|---|---|
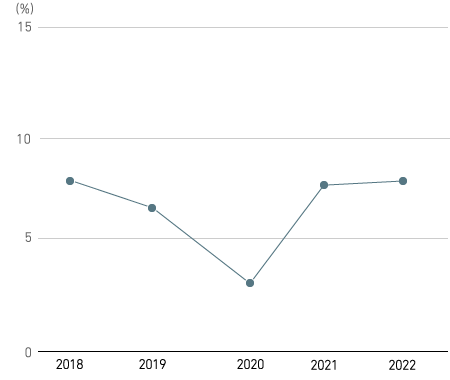
| Return on equity (ROE) | % | 7.9 | 6.6 | 3.1 | 7.7 | 7.9 |
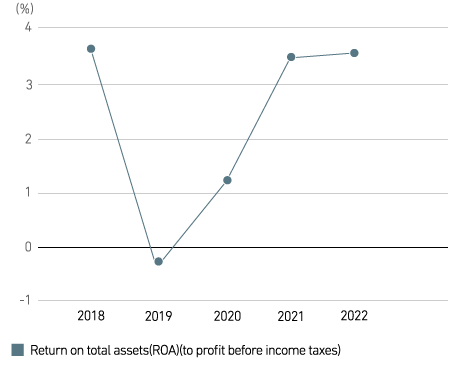
| Return on total assets (ROA)
(to profit before income taxes) |
% | 3.7 | -0.6 | 1.0 | 3.5 | 3.6 |
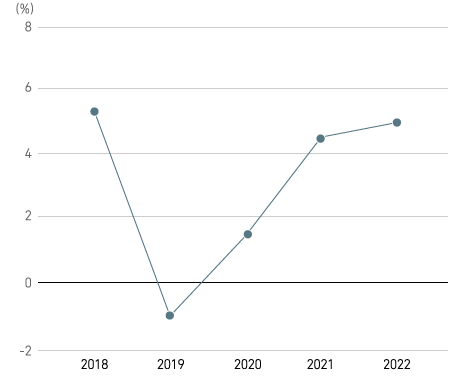
| Ratio of profit from business activities | % | 4.9 | -0.7 | 1.5 | 4.2 | 4.6 |
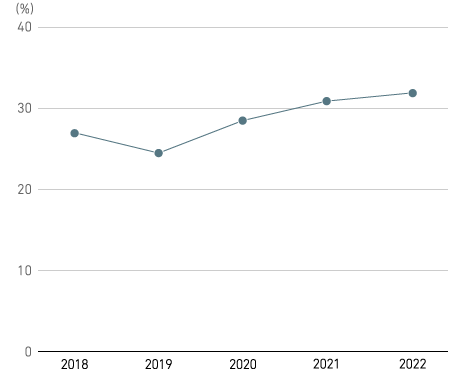
| Equity to assets ratio | % | 26.9 | 24.4 | 28.4 | 30.8 | 31.8 |
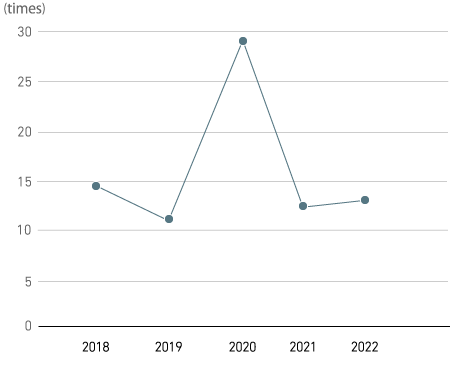
| Price earnings ratio (PER) | times | 14.00 | 10.53 | 28.52 | 11.89 | 12.55 |
| Earning per share (EPS) | yen | 328.52 | 259.39 | 120.92 | 338.24 | 388.43 |
| Book value per share (BPS) | yen | 4,204.71 | 3,627.73 | 4,064.73 | 4,696.42 | 5,183.10 |
| Debt to equity ratio | % | 38 | 46 | 63 | 44 | 40 |
Return on equity (ROE)
Return on total assets (ROA)
Ratio of profit from business activities
Equity to assets ratio
Price earnings ratio (PER)
- Return on equity (ROE) = profit (loss) attributable to owners of parent / equity attributable to owners of parent average of the beginning and the end of period
Return on total assets (ROA) (to profit before income taxes) = profit before income taxes / total assets average of the beginning and the end of period
Ratio of profit from business activities = profit from business activities / revenue
Equity to assets ratio = equity attributable to owners of parent / total assets
Price earnings ratio (PER) = stock price (year-end close) / income (loss) per share
Earning per share (EPS) = profit (loss) attributable to owners of parent / total number of shares issued
Book value per share (BPS) = Net assets / total number of shares issued
Debt to equity ratio = Interest bearing-debt / equity
Main Financial Index (JGAAP) for FY 2008-2017
| Unit | FY2013 | FY2014 | FY2015 | FY2016 | FY2017 | |
|---|---|---|---|---|---|---|
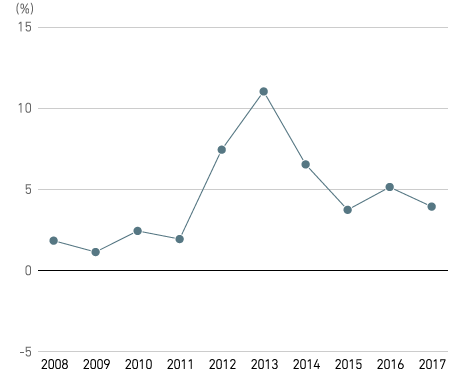
| Return on equity | % | 11.0 | 6.5 | 3.7 | 5.1 | 3.9 |
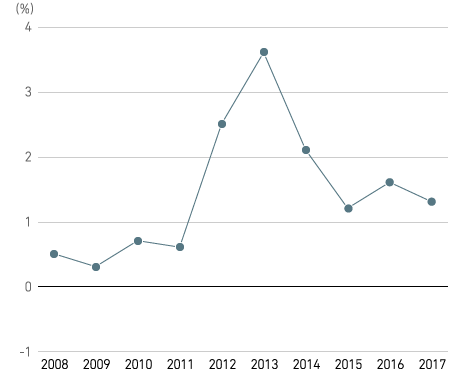
| Return on total assets | % | 3.6 | 2.1 | 1.2 | 1.6 | 1.3 |
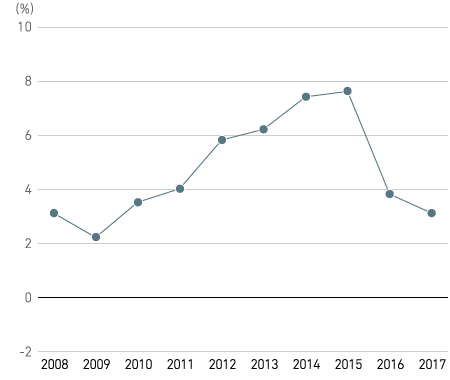
| Operating income ratio | % | 6.2 | 7.4 | 7.6 | 3.8 | 3.1 |
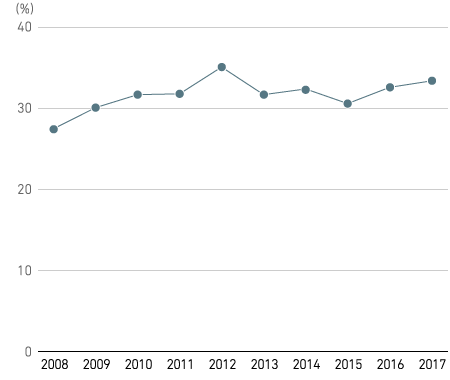
| Equity to assets ratio | % | 31.6 | 32.3 | 30.5 | 32.5 | 33.3 |
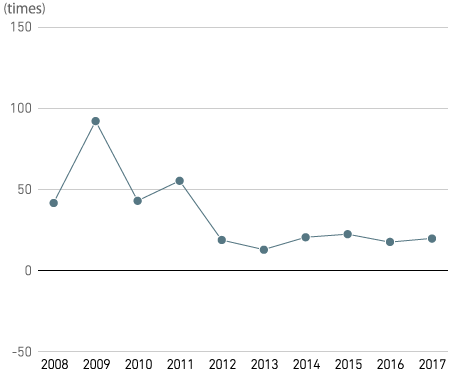
| Price earnings ratio | times | 12.5 | 20.1 | 22.0 | 17.1 | 19.4 |
| Earning per share | yen | 47.81 | 32.9 | 19.02 | 26.12 | 209.82 |
| Book value per share | yen | 459.99 | 530.65 | 500.30 | 530.86 | 5431.02 |
| Unit | FY2008 | FY2009 | FY2010 | FY2011 | FY2012 | |
| Return on equity | % | 1.8 | 1.1 | 2.4 | 1.9 | 7.4 |
| Return on total assets | % | 0.5 | 0.3 | 0.7 | 0.6 | 2.5 |
| Operating income ratio | % | 3.1 | 2.2 | 3.5 | 4 | 5.8 |
| Equity to assets ratio | % | 27.4 | 30 | 31.6 | 31.7 | 35.0 |
| Price earnings ratio | times | 41.3 | 91.7 | 42.6 | 54.9 | 18.4 |
| Earning per share | yen | 7.22 | 4.22 | 8.97 | 7.31 | 29.01 |
| Book value per share | yen | 369.94 | 380.8 | 376.17 | 374.08 | 410.9 |
Return on equity
Return on total assets
Operating income ratio
Equity to assets ratio
Price earnings ratio
- Return on equity = profit (loss) attributable to owners of parent / stockholders' equity average of the beginning and the end of period
Return on total assets = profit (loss) attributable to owners of parent / total assets average of the beginning and the end of period
Operating income ratio = operating income (loss) / Net sales
Equity to assets ratio = stockholders' equity / total assets
Price earnings ratio = stock price (year-end close) / income (loss) per share
Earning per share = profit (loss) attributable to owners of parent / total number of shares issued
Book value per share = Net assets / total number of shares issued